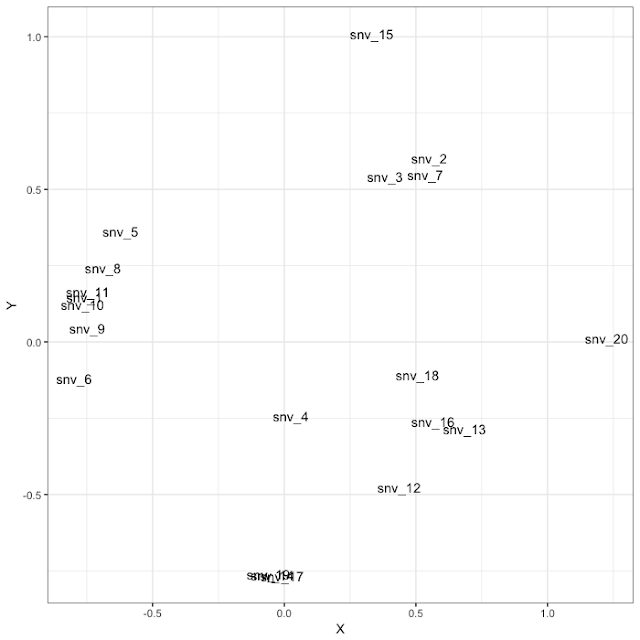
Here's a handy little visualization when you're interested in the correlations between your rasters. Basically it takes the matrix of absolute values of correlation coefficients for a set of rasters, turns it into a distance matrix, and then does MDS scaling on it. The resulting coordinates are turned into a nice little plot, where highly correlated variables are plotted closer to each other than more uncorrelated variables. It's a good way to eyeball relationships during variable selection. Here's one for a set of 20 bioclimatic variables.
Currently this is on the develop branch on GitHub, but I'll be merging it into the master branch as soon as it passes through testing.
![]()
Currently this is on the develop branch on GitHub, but I'll be merging it into the master branch as soon as it passes through testing.